

app store badge google play badge

Get the mobile app for the best Kahoot! experience!

Hannah Harris 28 Aug 2026

Back to case study

Teacher Takeover: How one middle school teacher turned digital assessment into student growth with measurable impact

Kahoot! Ambassador, Debbie B, shares how assessment data can tell an important story–but only when it is collected consistently, aligned to what students are expected to learn, and used to guide what happens next.

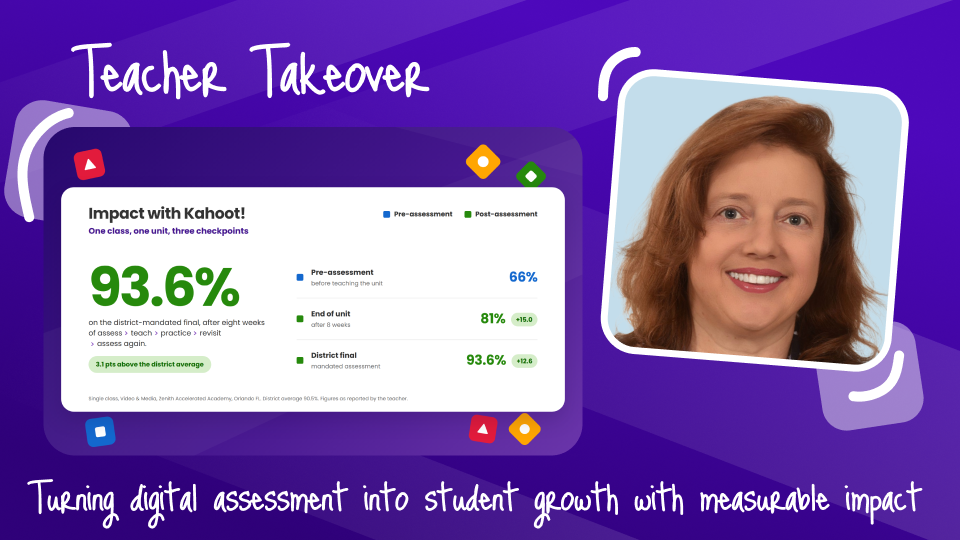
portrait of ambassador, Debbie, with "teacher takeover: turning digital assessment into student growth with measurable impact" title

For Debbie Bohanan, a Video and Media teacher at Zenith Accelerated Academy in Orlando, Florida, digital assessment has long been part of her teaching process. A long-time Kahoot! user, Debbie regularly incorporates Kahoot! into daily instruction and review, giving students frequent opportunities to practice content, check their understanding, and revisit concepts.

So when her district mandated that all end-of-year assessments be digitized for the 2025–26 school year, the transition was seamless.

Her students were already comfortable with digital assessment. Through Debbie’s decade of using Kahoot! for formative assessment, she’s facilitated over 2,100 kahoot reports. These stats don’t lie – Debbie already had a routine for administering pre-assessments and using the results to inform instruction. And, importantly, she had a way to turn the district’s existing paper-based assessment into an interactive digital review experience without manually rebuilding dozens of questions.

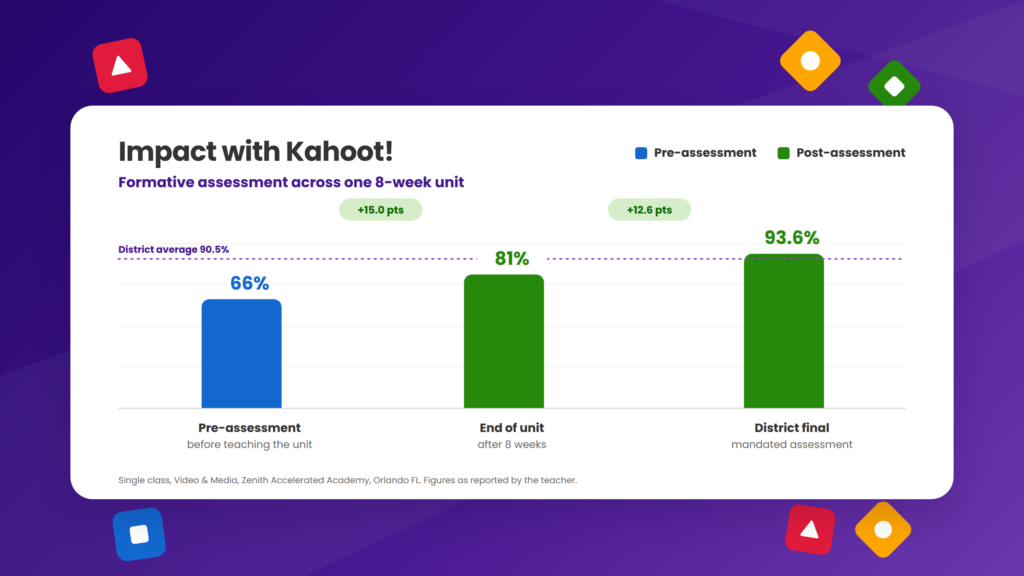
What followed was a measurable progression in student performance: 66% on the pre-assessment, 81% after eight weeks of instruction, and 93.6% on the district-mandated assessment—3.1 percentage points above the district average.

The results at a glance

The progression represents a 15-percentage-point increase from the initial assessment to the end-of-unit assessment. On the final district assessment, Debbie’s students outperformed the district average by 3.1 percentage points.

But the numbers don’t tell the whole story. The real impact came from what happened between those assessments.

Starting with a baseline

When Debbie administered her pre-assessment, her students averaged 66%. For Debbie, that score wasn’t simply a measurement of what students didn’t know. It was a starting point. Because Kahoot! was already part of her daily classroom routine, students were familiar with the process of answering questions digitally, receiving feedback, and engaging with review activities. There was no significant learning curve around the technology itself. That familiarity gave Debbie the opportunity to focus on the instructional work ahead: identifying areas that needed reinforcement and creating repeated opportunities for students to practice.

Over the next eight weeks, Kahoot! remained part of that process. Students encountered key content repeatedly through classroom instruction, review activities, and assigned game experiences. Rather than relying on a single study session before an assessment, Debbie built repeated exposure into the learning cycle. At the end of the unit, the class average had increased to 81%. That’s a 15-percentage-point gain from the original pre-assessment.

Turning a 50-question paper assessment into interactive practice

There was, however, another challenge to solve. The district’s assessment contained 50 questions, and because it was being used for standardized district reporting, the questions needed to exactly match the language students would encounter on the official assessment. Manually creating a 50-question Kahoot! would have taken Debbie a significant amount of time across many planning periods and after-hours sessions. She would have needed to type every question and answer option while ensuring the wording remained faithful to the original assessment.

Instead, she used Kahoot!’s PDF question extraction capability. By uploading the existing paper-based assessment as a PDF, Debbie was able to transform the ready-made questions into an interactive Kahoot! in seconds. The questions could then retain the language and content students were expected to know, while gaining the engagement and flexibility of digital practice. For Debbie, this workflow turned what could have been hours of manual preparation into a matter of seconds—and gave students a way to practice the actual questions and language they would encounter on the district assessment.
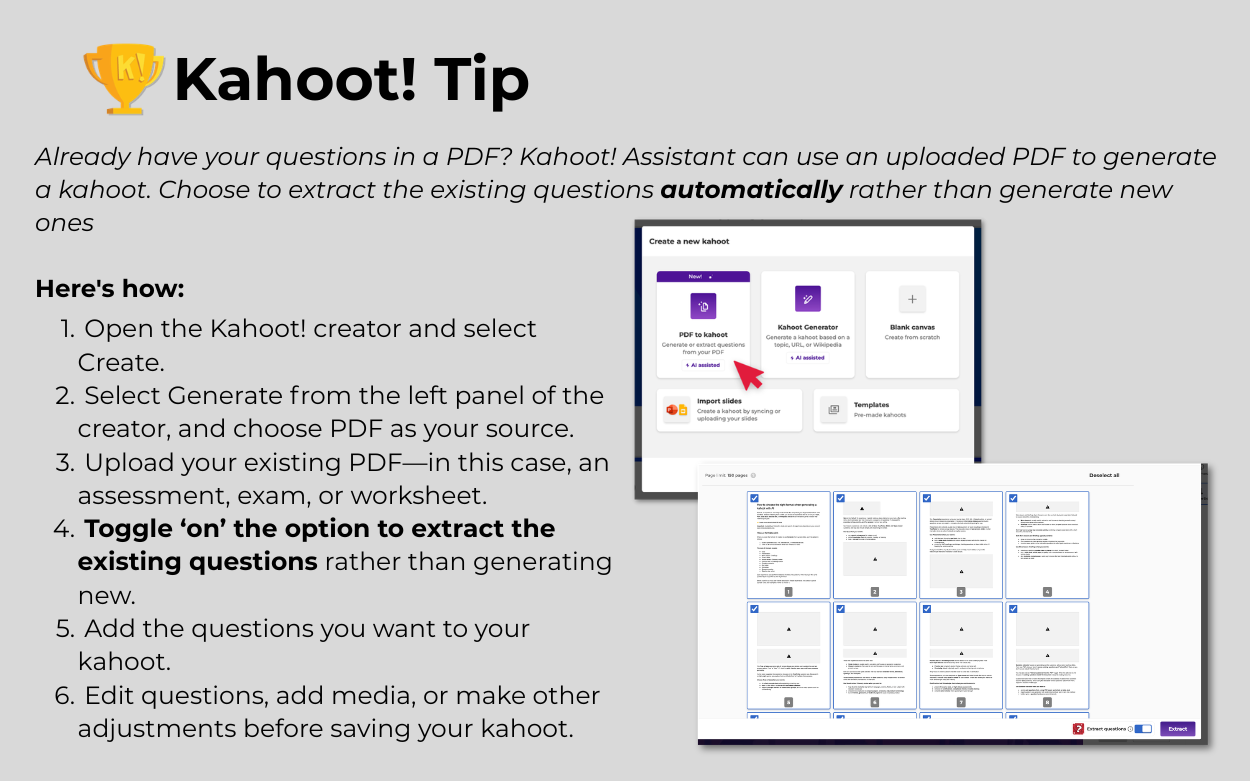
step by step directions for using PDF question extractor with Kahoot! Assistant


Keeping the practice going beyond the classroom

The review didn’t stop when students left the classroom. Debbie assigned game experiences that students could use to continue studying and reviewing independently. This gave students additional opportunities to encounter the same concepts and questions outside of instructional time. This repeated exposure was an important part of the process. Instead of seeing a question once and moving on, students had multiple opportunities to retrieve the information, recognize areas where they needed more practice, and strengthen their familiarity with the content. The approach created a continuous cycle:

Assess → teach → practice → revisit → assess again.

And because students were already familiar with Kahoot!, the digital format could extend naturally from the classroom into independent review.

three assessment scores tracked from 66% to 81% to 93.6%

The district assessment tells another part of the story

The most significant benchmark came when Debbie’s students took the district-mandated end-of-year assessment—the assessment used for whole-district reporting. Her students achieved a 93.6% class average, compared with a 90.5% district average. That means Debbie’s students not only improved substantially from their initial 66% baseline; they ultimately performed 3.1 percentage points above the district average on the common assessment. The progression is striking.

Of course, these results don’t establish that any single instructional tool caused the improvement. Student achievement is shaped by many factors, including instruction, practice, curriculum, and student effort. What the data does show is a clear pattern of growth within Debbie’s instructional cycle: students started with a measurable baseline, demonstrated improvement after eight weeks of instruction and review, and then achieved a final assessment average above the district benchmark.

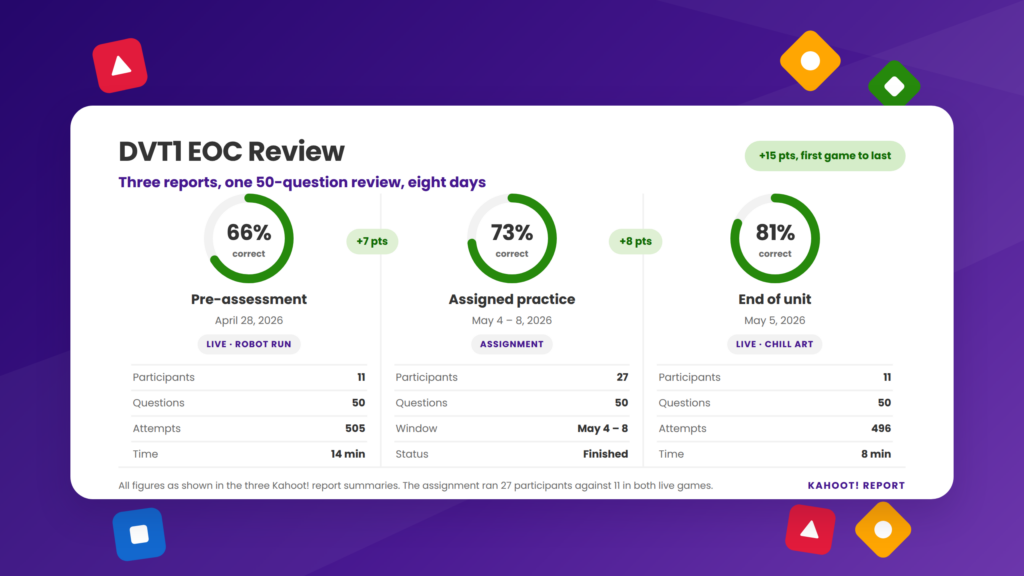
content reviewed through 66% assessment scores, 73% score, and 81% score showing different lesson and test administrations

When colleagues wanted to replicate the approach

The results didn’t go unnoticed. After seeing the progress Debbie’s students made, colleagues asked her to share the pre-assessment and post-assessment formats so other students could use the same approach and work toward similarly strong mastery scores. That response may be one of the most meaningful indicators of the case study’s impact.

Debbie’s approach wasn’t simply useful for her own classroom. It became a model that other educators wanted to explore and replicate. By creating a familiar assessment routine, aligning review content closely with the district assessment, and giving students repeated opportunities to practice, Debbie developed a workflow that could be shared beyond a single group of students.

Making assessment part of the learning—not just the measurement

Debbie’s experience demonstrates a straightforward but powerful assessment cycle:

Measure where students are → identify what they need → provide targeted and repeated practice → measure growth → apply learning to a common assessment.

The technology made that cycle easier to implement, but the instructional strategy came first. Kahoot! gave Debbie a familiar digital environment for pre-assessment and review. PDF question extraction saved her the considerable time it would have taken to manually recreate a 50-question assessment. Assigned game modes extended practice beyond the classroom. And repeated exposure gave students more opportunities to interact with the material before the final assessment.

The measurable results provide a compelling snapshot:

  • 66% — students’ starting point
  • 81% — class average after eight weeks
  • 93.6% — final district assessment score
  • 90.5% — district average

For Debbie, digital assessment wasn’t simply a replacement for paper and pencil. It became part of a larger instructional strategy—one that gave her actionable information, gave students more opportunities to practice, and ultimately helped make student growth visible. And perhaps that’s the most important lesson from her classroom: assessment is most powerful when it doesn’t simply tell us what students know. It helps us decide what to do next.