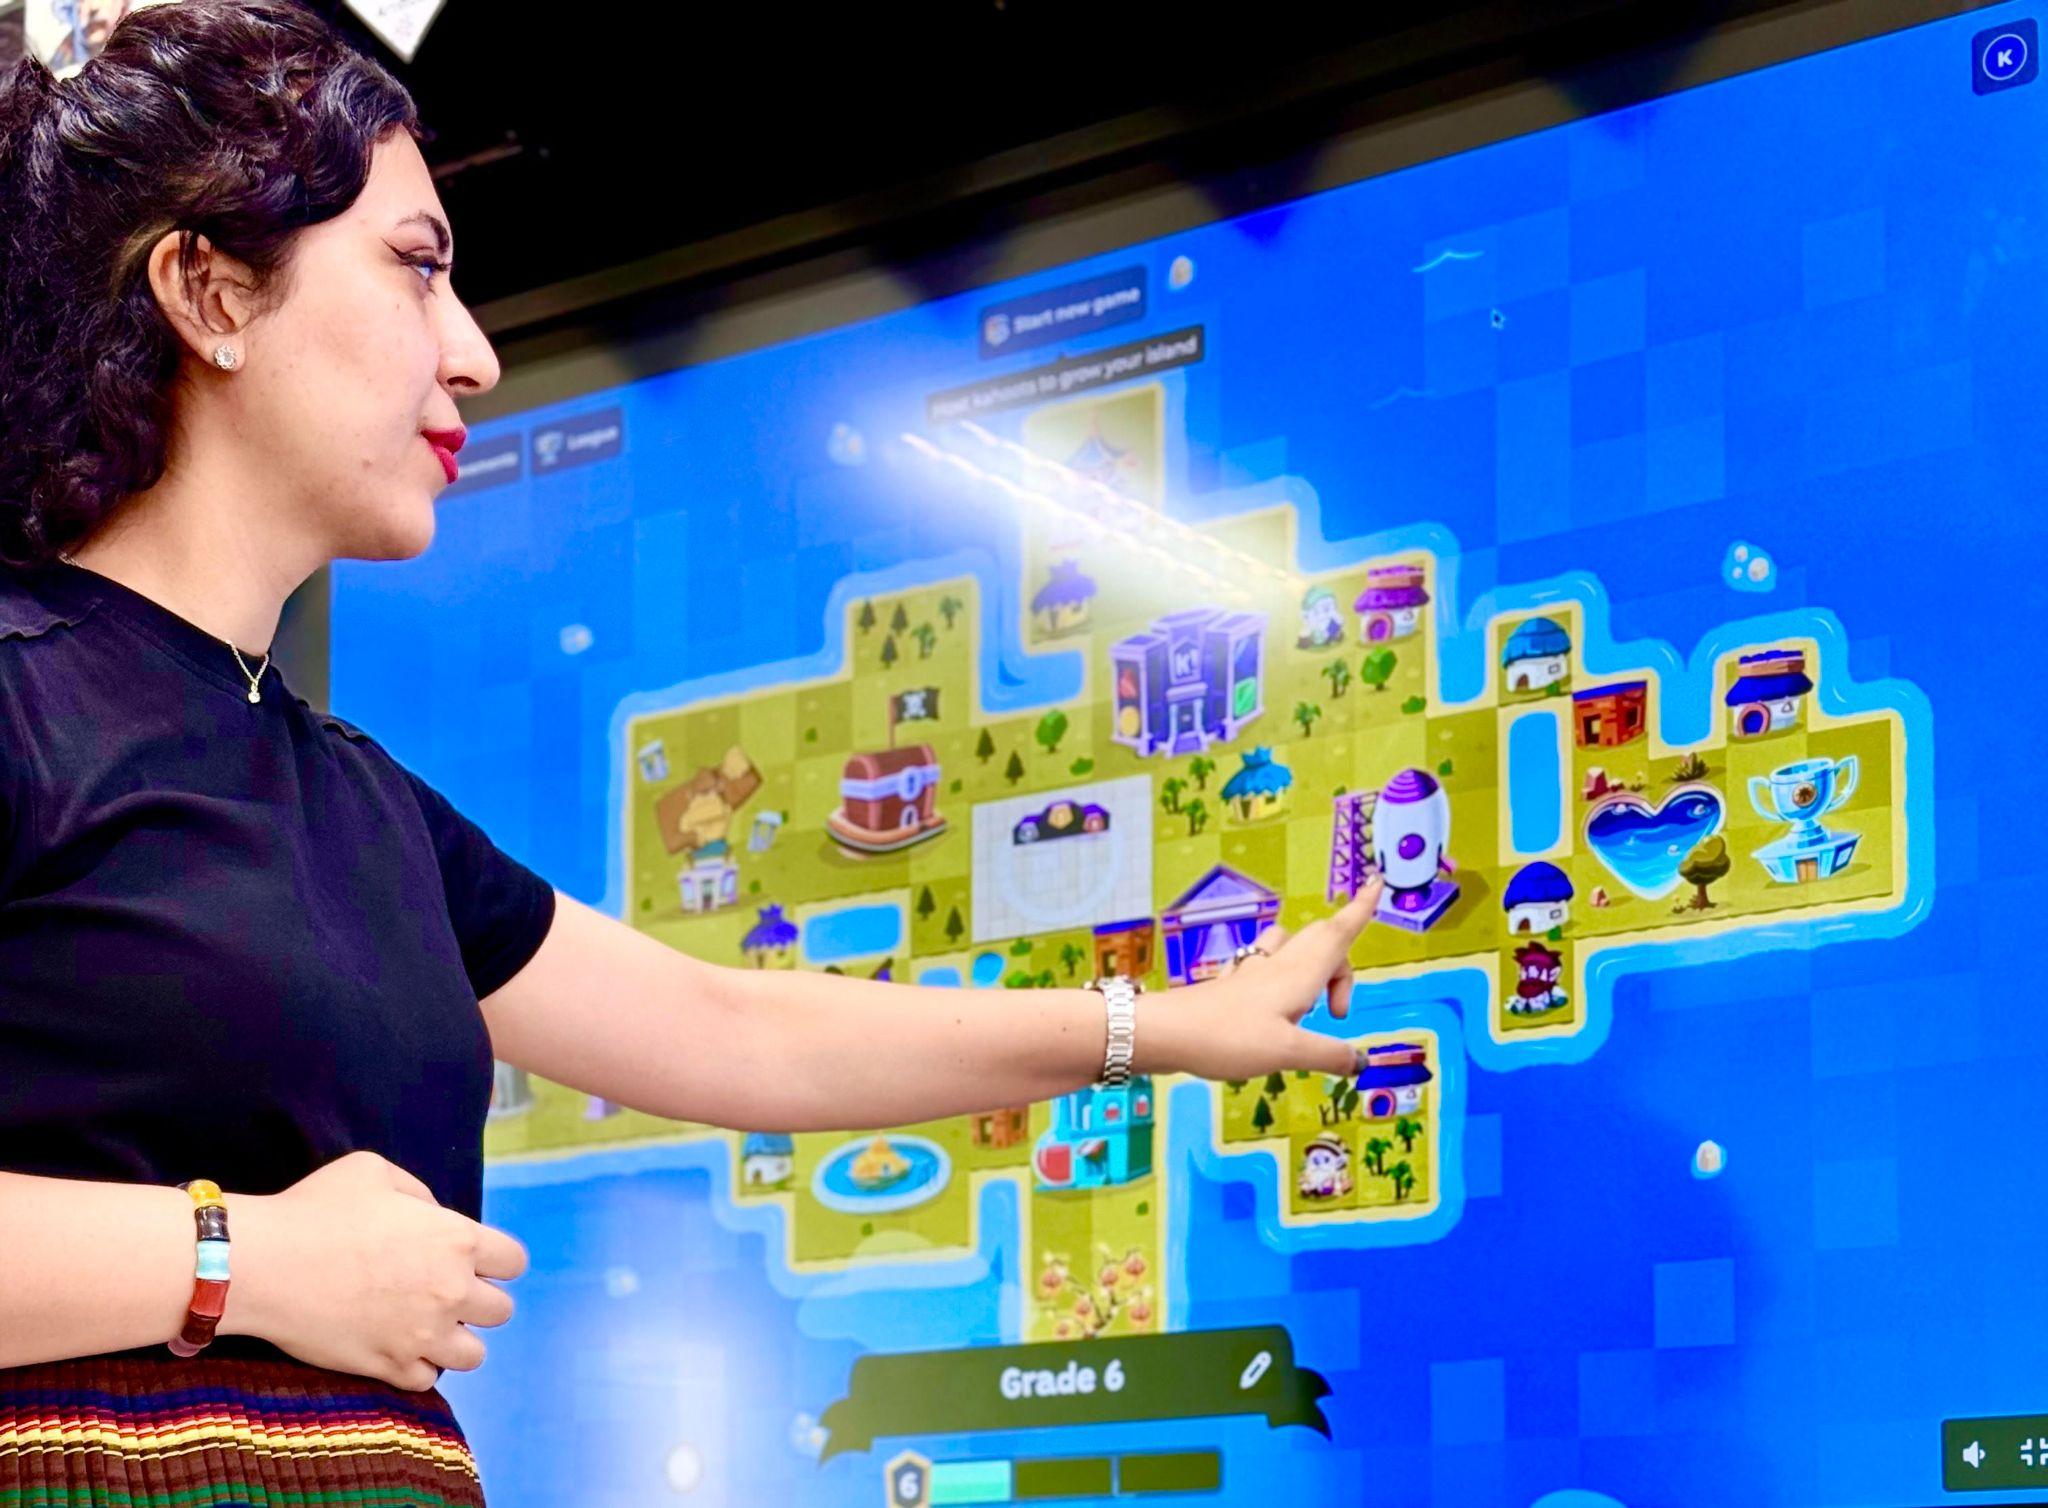
Sabina Mammadova is a science teacher for grades 6 and 7, teaching with the Modified Cambridge Curriculum. She also works as a PLC (Professional Learning Community) member of the One World International School in Singapore. While Sabina has created content on the Kahoot! Marketplace and shared her intel and insights for new content and courses, read on to hear how she manages learning from behind-the-screen, diving deep into reporting data and qualitative information!

As a teacher, I use Kahoot! not just for fun and engagement, but as a powerful formative assessment and data-informed teaching tool. The Reports feature allows me to track student progress, identify learning gaps, and adapt my teaching based on real-time data. Since I began using it regularly, I’ve noticed a significant improvement in how I support individual learners and plan my lessons.
The Reports Section
While Kahoot! is widely known for making learning fun, many teachers may not realize that it also generates detailed reports after every game. These reports provide valuable insights, whether you’re using Live Classic mode or Live Game mode.

Here’s what you’ll find inside:
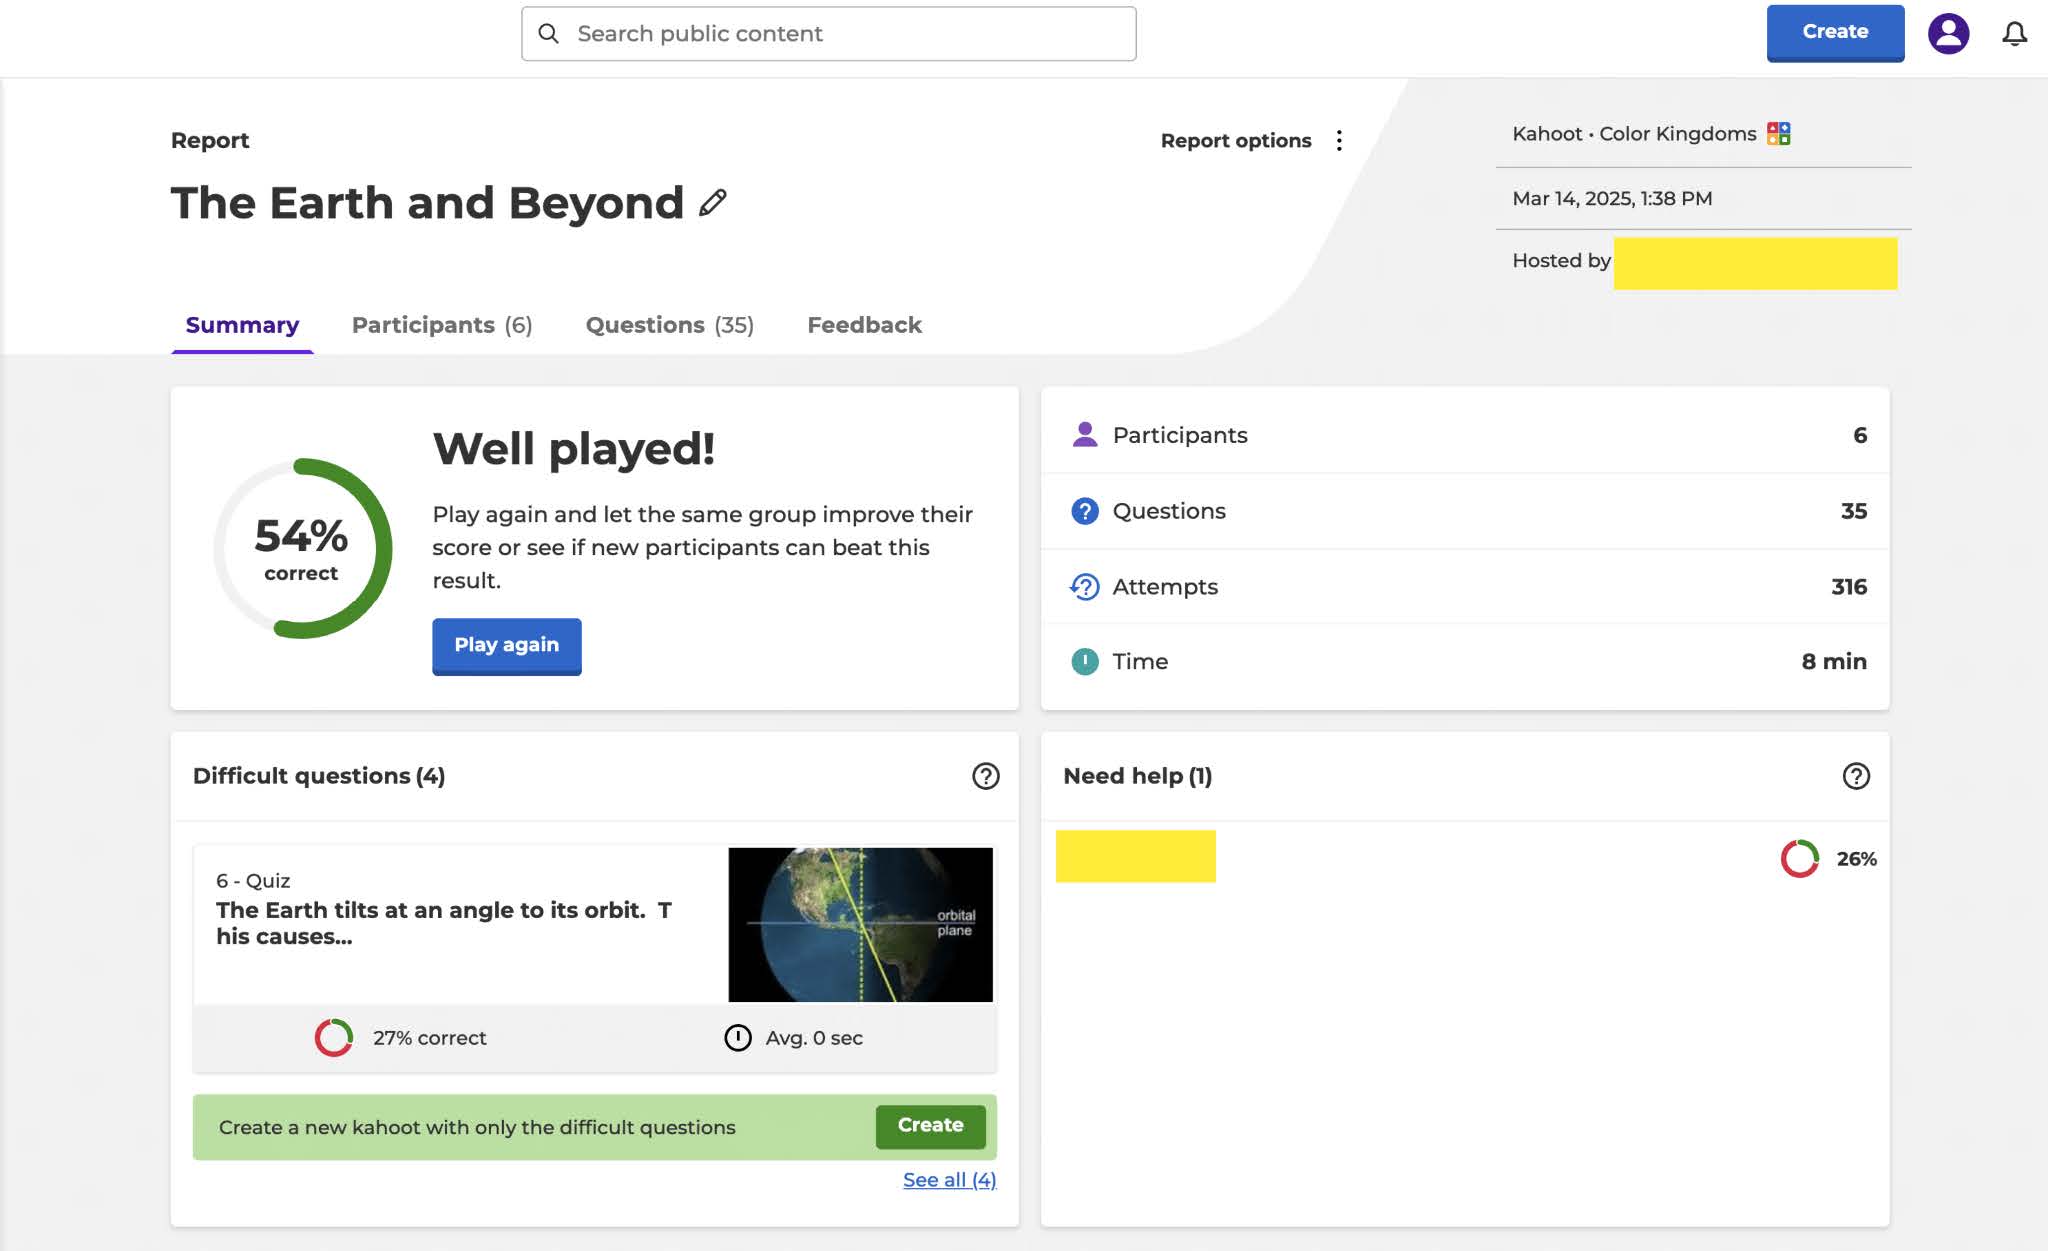
- Summary: This section in Kahoot! Reports provide a comprehensive overview of each quiz. It includes key details such as the overall results, the number of participants, total questions, and the quiz duration. You can also revisit the Podium to see the top performers and share it via a link.One of the most useful aspects of this section is the ability to see which students didn’t complete the quiz and who may need additional support. This insight allows teachers to identify learning gaps, adjust instruction, and offer targeted resources or explanations.Another standout feature is the identification of difficult questions—those that many students answered incorrectly. Even better, Kahoot! lets you instantly generate a new quiz using only these challenging questions. It’s a fantastic way to reinforce learning right after the original quiz with a short, focused follow-up activity.
- Participants: This section shows individual performance, including scores, rankings, percentage of correct answers, and unanswered questions. Students needing help are listed separately, which is a huge time-saver.
- Questions: You get a breakdown of how each question was answered, including percentages of correct and incorrect responses. The system highlights difficult questions automatically.
- Feedback (optional): If enabled, students can rate the quiz, leave written comments, and reflect on their learning experience.

Report Options
One of the most useful features in the Report Options is the ability to download a detailed report as an Excel file. This file includes an overview, final scores, a summary of the Kahoot, flow report data, and a question-by-question breakdown of correct and incorrect answers.
You can also find printing options within the Report Options menu, which is helpful for sharing results in meetings or keeping records. Additionally, the Reports section allows you to view and compare results from the same quiz played at different times, making it easier to track student progress over time. From this section, you can also revisit the kahoot or move the report to the Trash Bin if it’s no longer needed.
Why this matters: Real-Time insights for smarter teaching
Using Kahoot! Reports has brought several key benefits to my teaching:
- Data-driven support: If I notice that a specific question was missed by most students, I know it’s time to reteach or explain the concept differently in the next lesson.
- Focused revision: With the “Create from Difficult Questions” feature, I can run a short review session immediately—without wasting time on questions students have already mastered.
Tips for teachers using Kahoot! Reports
If you’re just getting started with Kahoot! Reports, here are three tips to make the most of it:
- Start with the “Summary” and “Participants” tabs.
These give you a clear snapshot of class performance and help identify students who need support right away. - Use the “Create Kahoot from Difficult Questions” feature.
It’s a quick way to build a focused quiz that targets areas of difficulty without starting from scratch.
We can collect valuable data from the Reports and use it to evaluate the learning process. This data allows us to create follow-up quizzes using the most challenging questions, explain confusing concepts more clearly to students, and even organize class discussions to explore why certain questions were difficult and how students could approach them differently.
Whether you’re supporting individual learners through differentiated curriculum, planning a re-teach, or preparing for a parent conference, the Reports feature can give you clarity. It’s like having a teaching assistant that helps you make better decisions, every class.
Ready to take your reporting to the next level? Hone in on your skills and expertise with this Kahoot! mini-course, and learn all there is to know about Reports in just ten minutes.


