
Initially we surveyed tools to gather JVM memory usage metrics. They were useful to gain a better understanding of how to measure memory usage. I made a small pull request to jps_stat, to be able to gather one-time statistics about our gameserver application memory. However, now that I’ve had some more time to digest all the information, I believe the best tool is jvmtop.
It’s simple, easy to understand and provides the key memory numbers. It’s packaged as a JAR file, so it needs Java to work. It’s not as practical to use as a simple shell script, but it shows a precise picture of the JVM instant memory usage, both in terms of heap and non-heap.
Understanding JVM memory usage
I am probably the last person on the planet who should talk about JVM… Luckily there are a lot of informative articles out there. At the bottom of this post, there’s a list of the ones I found most useful for this research. If you only have time to read one, I would recommend starting with the Memory Calculator Google document.
For the sake of this blog post, the only necessary things to highlight are the following. The memory used by the JVM is divided in two main logical sections, heap and non-heap:
- The heap roughly corresponds to the area where regular Java objects are allocated
- Non-heap memory holds many things. Among them, internal objects necessary for the JVM itself to work, garbage collection data structures, class caches, and more importantly, thread stacks and native I/O buffers.
Certain applications, typically HTTP or network servers, use native I/O buffers to transfer data from and to the clients. The size of these buffers can often be changed by configuration directives.
Every JVM thread stack is by default 1 Mb but can be changed by the -Xss JVM flag. The more threads you spawn, the higher the memory usage will be. While figuring all of this out, I wrote a small tool to help me parse the Linux process memory map, which can confirm the thread stack size among other things. Later on I discovered that, of course, Linux comes with a useful pmap command which can do whatever my simple script does and much more.
Heap vs non-heap memory
Our gameserver — Merlin — is an application that must be stable and ideally run uninterrupted for many months, continuously creating and disposing of game and client sessions. If any memory-related defects are present in the software, they will usually manifest themselves as unbound memory usage growth. In the typical case, heap memory usage generally grows over time, while non-heap memory is mostly allocated at startup.
The first test we performed consisted of throwing massive traffic load at the gameserver application and verifying that heap usage did not grow over time, or at least that a healthy garbage collection cycle was reclaiming unused objects. To do this, we wrote a handy stress test client as part of our gameserver test suite.
We have never seen problems in our heap memory usage, so we are reasonably sure that there are no obvious memory leaks. We’ve also verified this using VisualVM locally. As a result, we did not need to tweak the JVM flags that influence heap memory size (-Xms and -Xmx, the favourite Java developer flags in the universe).
Non-heap usage on the other hand is not so straightforward to measure. As mentioned, it’s made up of several components and the link between each component and the related JVM flag that regulates its size is not always obvious. At least it wasn’t to me.
To cut a long trial-and-error story short, here’s the flags that helped us. We managed to lower our steady state memory usage by about 750 Mb, thus silencing most memory-related alerts we had in place.
(Another chapter dedicated to how top or ps report memory usage, the idea of a system’s virtual memory and the Linux OOM-killer could perhaps be in order, but maybe another time!)
The magic recipe!
We added the following three flags to the JVM command to invoke Merlin:
 -XX:CompressedClassSpaceSize=256m
 -XX:MetaspaceSize=64m
 -XX:MaxMetaspaceSize=256m
Note that these values are not universally valid. You may risk running into problems applying them blindly. The specific values that worked for us are a result of our particular application size and usage pattern. For different applications or use cases, you may need to tweak the numbers accordingly.
The compressed class space size is by default 1 Gb on Linux 64-bit machines, allocated at startup and never released. By setting it to 256 Mb as we did, we save about 750 Mb. The total virtual memory allocation for the gameserver goes down by about 750 Mb instantly at startup. That’s a fantastic result when your servers only have a handful Gb of system memory. Of course you don’t want to run out of class space memory. In our case, multiple tools (f.ex. VisualVM) indicated that we are only using ~50Mb of class space, so all is well.
Metaspace flags have a similar purpose but for the JVM “Metaspace”, used for class metadata, garbage collection algorithm data structures, etc… By setting the default metaspace size to 64 Mb and the max to 256 Mb, we ensured that metaspace memory is not left unbound, which is the default for MaxMetaspaceSize.
We have been rolling out these new settings to all gameservers for the past few weeks, and the result was quite striking:
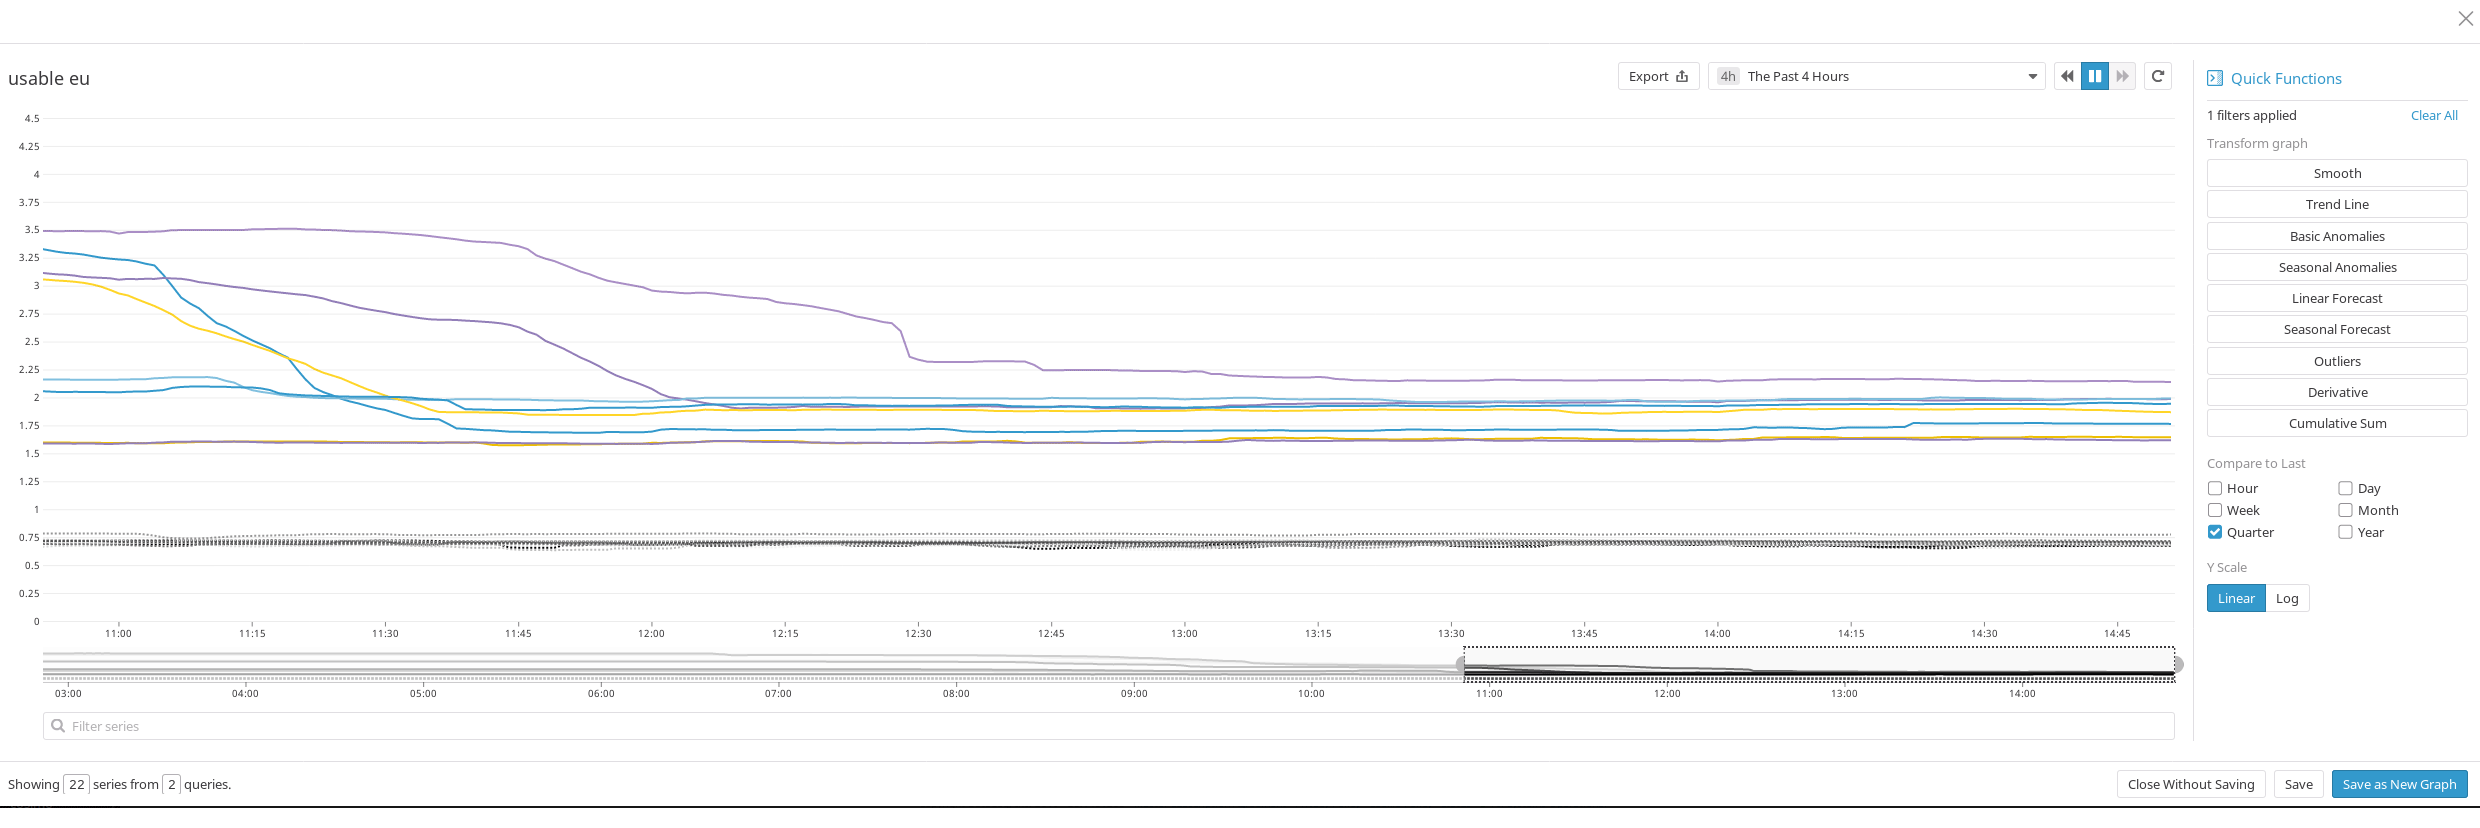
Chart of the “usable memory” metric for all Kahoot! gameservers in the EU region.
The chart above plots the “usable memory” of each gameserver: memory that is available and not currently in use. The lower the value, the higher the risk we are of running out of memory. The dotted grey lines represent the memory usage of the old gameserver software from three months ago, compared to the Merlin servers usable memory lines (colored).
The new settings have clearly made a difference. However, after a few more weeks of operation, we discovered that a few servers started to show signs of low usable memory again.
MALLOC_ARENA_MAX
We investigated further. Lots of web searching and stackoverflow-ing later, we found an indication that the malloc() function that is bundled in some versions of the GNU C library, including the one installed on our gameservers, tends to fragment memory in a way that leads to excessive virtual memory usage for long running processes.
Based on this information, we applied another change, lowering the MALLOC_ARENA_MAX variable to 4 (four). According to documentation and bugs filed online, setting the value of the MALLOC_ARENA_MAX environment variable to a value between 2 and 4 allows to curtail the non-heap memory usage growth for JVM processes over time.
To apply this change, it’s sufficient to start the Java process after having exported the variable to the shell environment, as in:
export MALLOC_ARENA_MAX=4
java $JVM_OPTS -jar ...
We have rolled out all these changes to some of our servers and have seen another clear improvement with regards to usable memory over long periods of time (2-3 weeks). We will continue to monitor Merlin‘s memory usage for the next few weeks and months, especially as the school season starts. If it continues like it’s been so far, we will be able to run many more simultaneous games on the same hardware, without any stability or memory issues.
Reference articles
Here’s a list of articles and documents that proved to be valuable in the quest to understand memory usage of JVM applications:
- https://erikwramner.files.wordpress.com/2017/10/native-memory-leaks-in-java.pdf
- https://stackoverflow.com/questions/31075761/java-8-reserves-minimum-1g-for-metaspace-despite-maxmetaspacesize#31104372
- https://docs.oracle.com/javase/8/docs/technotes/tools/unix/java.html#BABHDABI
- https://docs.gigaspaces.com/latest/production/production-jvm-tuning.html
- https://stackoverflow.com/questions/6020619/where-to-find-default-xss-value-for-sun-oracle-jvm
- https://www.baeldung.com/native-memory-tracking-in-jvm
- http://jetty.4.x6.nabble.com/jetty-users-DirectByteBuffer-native-memory-problems-OOM-with-Jetty-9-0-9-1-td4961615.html
- https://stackoverflow.com/questions/53451103/java-using-much-more-memory-than-heap-size-or-size-correctly-docker-memory-limi
- Memory Calculator v3 Document